
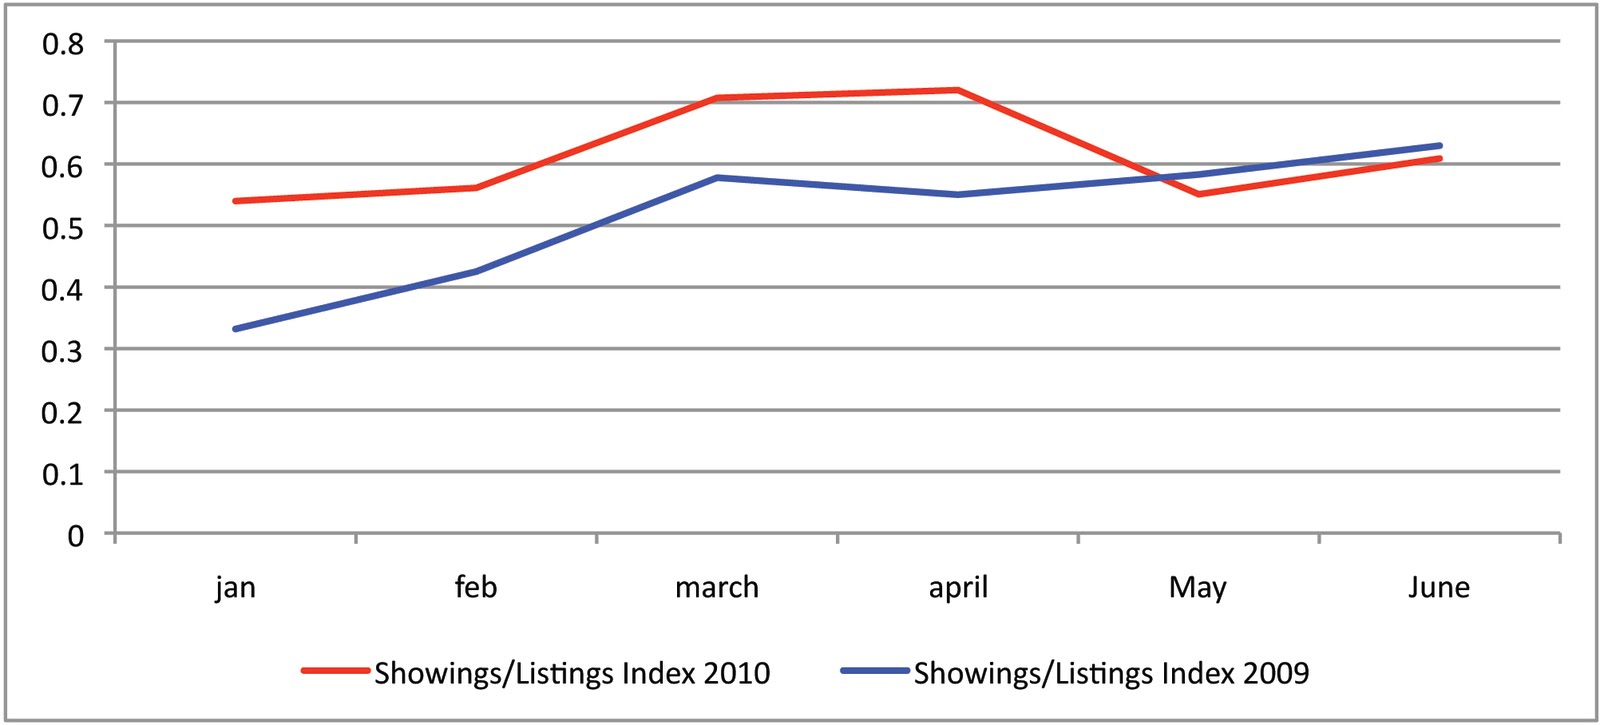
The number of showing appointments on Real Estate One active listings in May and June fell compared to last year, which would indicate there may be fewer buyers in the market. However, there are also fewer houses available to look at so by creating a Showings/Listings comparison we can get a better "apples to apples" look at buyer activity. The graphical Index below shows buyer activity is up over last year and certainly it did fall after April, but only to the same levels as last year. This gives a positive indication that there is still pent up post tax credit demand with current buyer interest actually about equal to last year.
Showings to Listing Index - 10' vs 09'
No comments:
Post a Comment