
Showing posts with label Real Estate Market. Show all posts
Showing posts with label Real Estate Market. Show all posts
Wednesday, July 28, 2010
May Case-Shiller Report
Click here for the May Case-Shiller report. It shows that most markets, including the Metro Detroit area, are showing a slowing down of Home value declines to even a flat (and in a few cases increasing) value market for the first few months of 2010. Those numbers reflect the combined effects of low mortgage interest rates, an improving economy, Home Buyer tax credits and reduced available property inventories. Of those, the Home Buyer tax credits had the most influence through April, but the rest helped carry some home value stability through May and June as well. So far in July we are seeing the slowing we had expected, post tax credit, but we will not be able to get a true feeling for the Michigan real estate market until September, once the market has digested the tax credit effects. The good news is our Real Estate One Family's websites are experiencing continual activity growth, showing that underlying buyer interest is growing!


Wednesday, July 14, 2010
Michigan Real Estate Market Overview
The June Michigan Real Estate Market followed what we had expected, slowing from the peak activity levels prior to the tax credit expiration. The good news is that our slowdown in Michigan has been less than most of the other markets across the nation. Available home (active listing) inventories continue to fall which will help to stabilize value declines. The months supply of inventory for the Metro Detroit Area remains at a two year low of under six months (compared to the high in Nov. of 08' of over 14 months), it still remains a Buyer's market, but it is moving in the right direction.
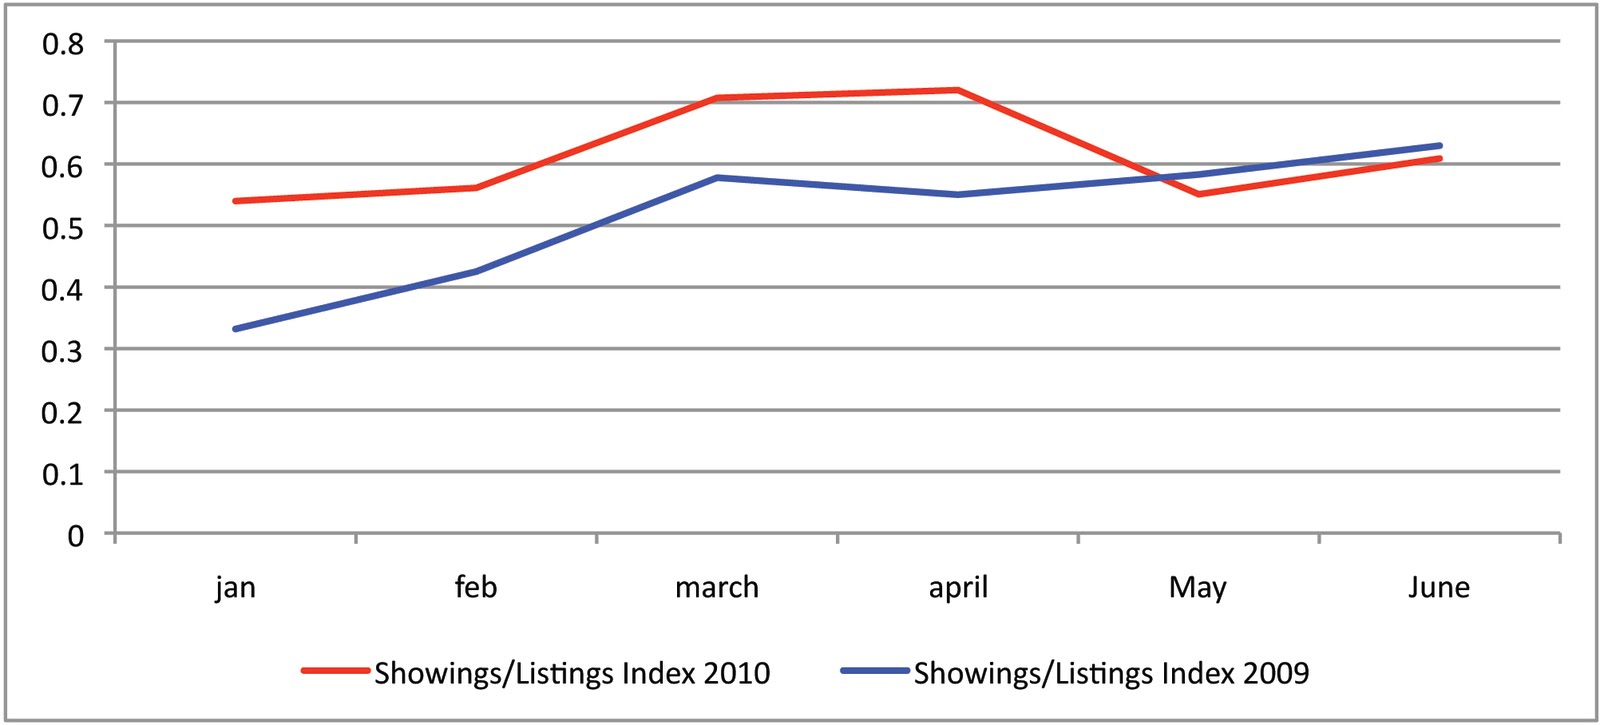
The number of showing appointments on Real Estate One active listings in May and June fell compared to last year, which would indicate there may be fewer buyers in the market. However, there are also fewer houses available to look at so by creating a Showings/Listings comparison we can get a better "apples to apples" look at buyer activity. The graphical Index below shows buyer activity is up over last year and certainly it did fall after April, but only to the same levels as last year. This gives a positive indication that there is still pent up post tax credit demand with current buyer interest actually about equal to last year.
Showings to Listing Index - 10' vs 09'

The number of showing appointments on Real Estate One active listings in May and June fell compared to last year, which would indicate there may be fewer buyers in the market. However, there are also fewer houses available to look at so by creating a Showings/Listings comparison we can get a better "apples to apples" look at buyer activity. The graphical Index below shows buyer activity is up over last year and certainly it did fall after April, but only to the same levels as last year. This gives a positive indication that there is still pent up post tax credit demand with current buyer interest actually about equal to last year.
Showings to Listing Index - 10' vs 09'
Subscribe to:
Posts (Atom)